
In Buying Companies – Part I we defined shares for what they are – part ownership in a company, and we had a quick look at valuations using the ‘quick and dirty’ P/E Ratio. Quick recap… P/E ratio is the market cap of a company divided by its Net Profit After Tax. Whilst P/E ratios are certainly helpful, and a great place to start, they not an appropriate valuation method for many companies due to 5 key factors:
1. Some companies don’t have earnings (profit) yet.
If you’ve ever tried to divide something by 0 in excel, you would have seen this…. #DIV/0! That exactly whats going on when you try to value a company with no profits using a P/E ratio! So how are these companies valued? Pundits will argue about the correct valuation method for these companies depending on which sector the operate in, but suffice it to say that it is all about their future potential earnings.
For example, Xero currently produces revenue of $290M, but a net loss of $67M. So why then does the market ascribe it a market cap of $3.3 Billion???!!!
Well, Xero currently spends $167M per year on marketing – which helped the company grow revenue at 44% year on year. When Xero is ready, and has captured enough of the market, sales & marketing budgets will be slashed, operating costs will be reigned in, and Xero will reveal massive profits. Amazon – though it sports the 4th largest Market Cap of any public company is still turns out minuscule profits… purely because it is reinvesting for growth.
2. A company might have artificially inflated revenue due to recognising prior year tax losses (which won’t reoccur once all tax loss credits have been exhausted)
Did you know that if you start a business and lose money for 5 years before turning a profit, your cumulative losses are offset against your profits? When this happens, a company’s tax return is recognised on its profit and loss statement as income. The excerpt below is taken from Nanosonics’ 2017 Annual Report. Note the $12.3M tax benefit received this year? This has the effect of artificially lowering the P/E ratio. $783M Market Cap / $26.1M NPAT = 30. If we look at the underlying earnings however (ignore the impact of the tax benefits which will expire in a year or two), the NPAT is $13.8M, and the P/E Multiple is 56.7.
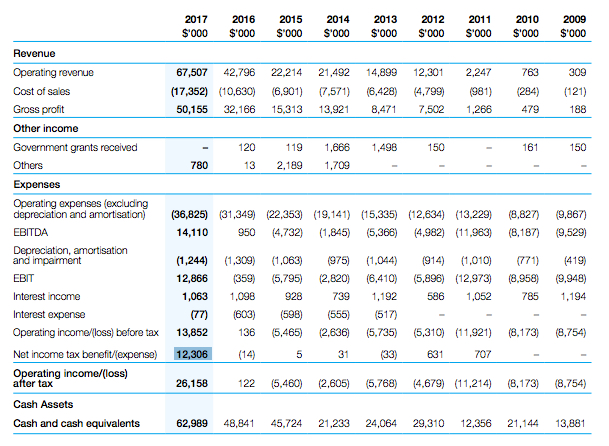
Taken from Nanosonics’ 2017 Annual Report
Obviously prior year tax losses can have a massive impact on a companies earnings for a few years until they are all offset against profits – worth watching out for in those early profit years.

3. Companies who are only recently profitable will have tiny profits, but much higher market caps due to the fact that the market is forward looking.
This has to do with ‘operating leverage’ – there is a minimum critical amount of Gross Profit that a company needs to make to cover its fixed costs. Once this point has been reached, every extra dollar of GP doesn’t incur these fixed costs, and more is allowed to fall the bottom line.
Here is what that looks like.
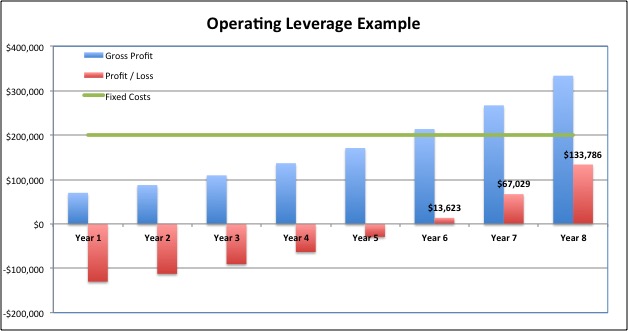
Our example uses a theoretical company growing gross profit at 25% per year, with fixed costs of $200,000. In Year 6, our company has its maiden profit year – $13,623. Lets assume the company has a market cap of $1,089,840 – on face value, a P/E multiple of 80! An investor might be forgiven for thinking that the company looks overvalued, but if we look closer, we see that in year 7 profit increases 392% to $67k due to the growing GP and fixed cost base. Using year 7 earnings in place of year 6 earnings gives us a P/E Multiple of only 16.26. This is what is referred to as a ‘Forward P/E ratio’.
4. There are many one off (non recurring) expenses or profits that might significantly affect NPAT, and artificially inflate or deflate the ratio.
Although companies might generally have a fairly predictable earnings profile, ‘exceptional items’ in their profit and loss statement can totally cruel a P/E ratios ability to assess the company’s true value. For example:
- A company sells a piece of realestate for a significant (one-off) capital gain.
- A company has a major restructure, and has a year of extra wage costs to due redundancies
- A court settlement (for or against)
- Cost of integrating an acquired business
- Foreign currency exchange gains / losses
Stripping out these exceptional items reveals the companies ‘underlying earnings’ which may more accurately reveal the companies true profitability.
5. There can be a massive difference between a company’s statutory earnings, and its underlying earnings.
Ever wonder why a company can report a MASSIVE loss, and the share price goes up? Take Origin Energy (ASX: ORG) for example, on the 16th of August ORG reporting a loss of $2.2 Billion!! (yes, Billion with a B), however, its share price rose swiftly on the day, and is up >14% as of the time of writing one month later (thank you very much).
This mega loss was the companies statutory result, which includes another class of ‘exceptional item’ that we didn’t discuss in point 4.
From time to time, a company has to consider the carrying value of the assets it has listed on the balance sheet and work out whether the value listed is in fact still valid. If the value of those assets are written down (or off) the ‘asset impairment’ has to be recognised as an expense through the P&L statement.
Lets use a retailer as an example….
Lets say a retail store owner has pretty poor stock control practices, and allows stock to age in the warehouse. A new accountant discovers that the business is carrying merchandise that is 3 seasons old, and deems that it will have a far lower value than the balance sheet suggests. The assets are tested for impairment, and the values written down accordingly. This ‘asset impairment’ has to be recognised as an expense through the P&L statement. Ignoring the asset impairment would reveal the companies ‘underlying earnings’ (though a prudent investor needs to question why the asset is being impaired in the first place). The following snippet is taken from Origin Energy’s 2017 Annual report. Note the $939M of expenses due to ‘Impairment of Assets’.
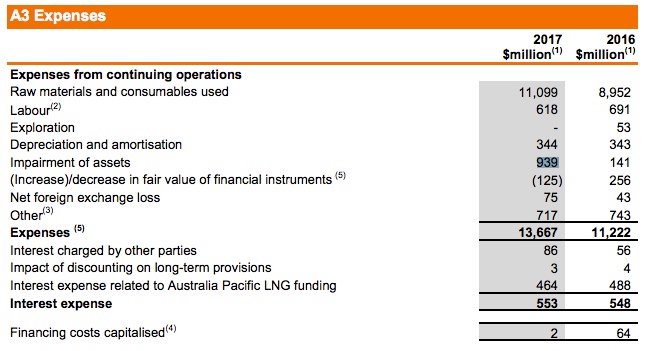
Taken from Origin Energy’s 2017 Annual report.
So there you have it, 5 ways that a P/E ratio can bring you unstuck – thats why it always pays to read financial statements in full, not just rush to the bottom line.
Happy Investing.